How is your app doing in production?
Observe is wired into how mobile apps ship. It ties every performance metric to the exact build and update that caused it, so you instantly understand the impact of every release.
$ npx expo install expo-eas-observe
Monitoring that knows your build pipeline
Because it’s built across your runtime, builds, and updates, Observe sees more out of the box.
Measure what users feel
TTI, cold and warm launches, frame drops, and bundle load on real devices across every session, now captured automatically with no custom traces needed.
See every build
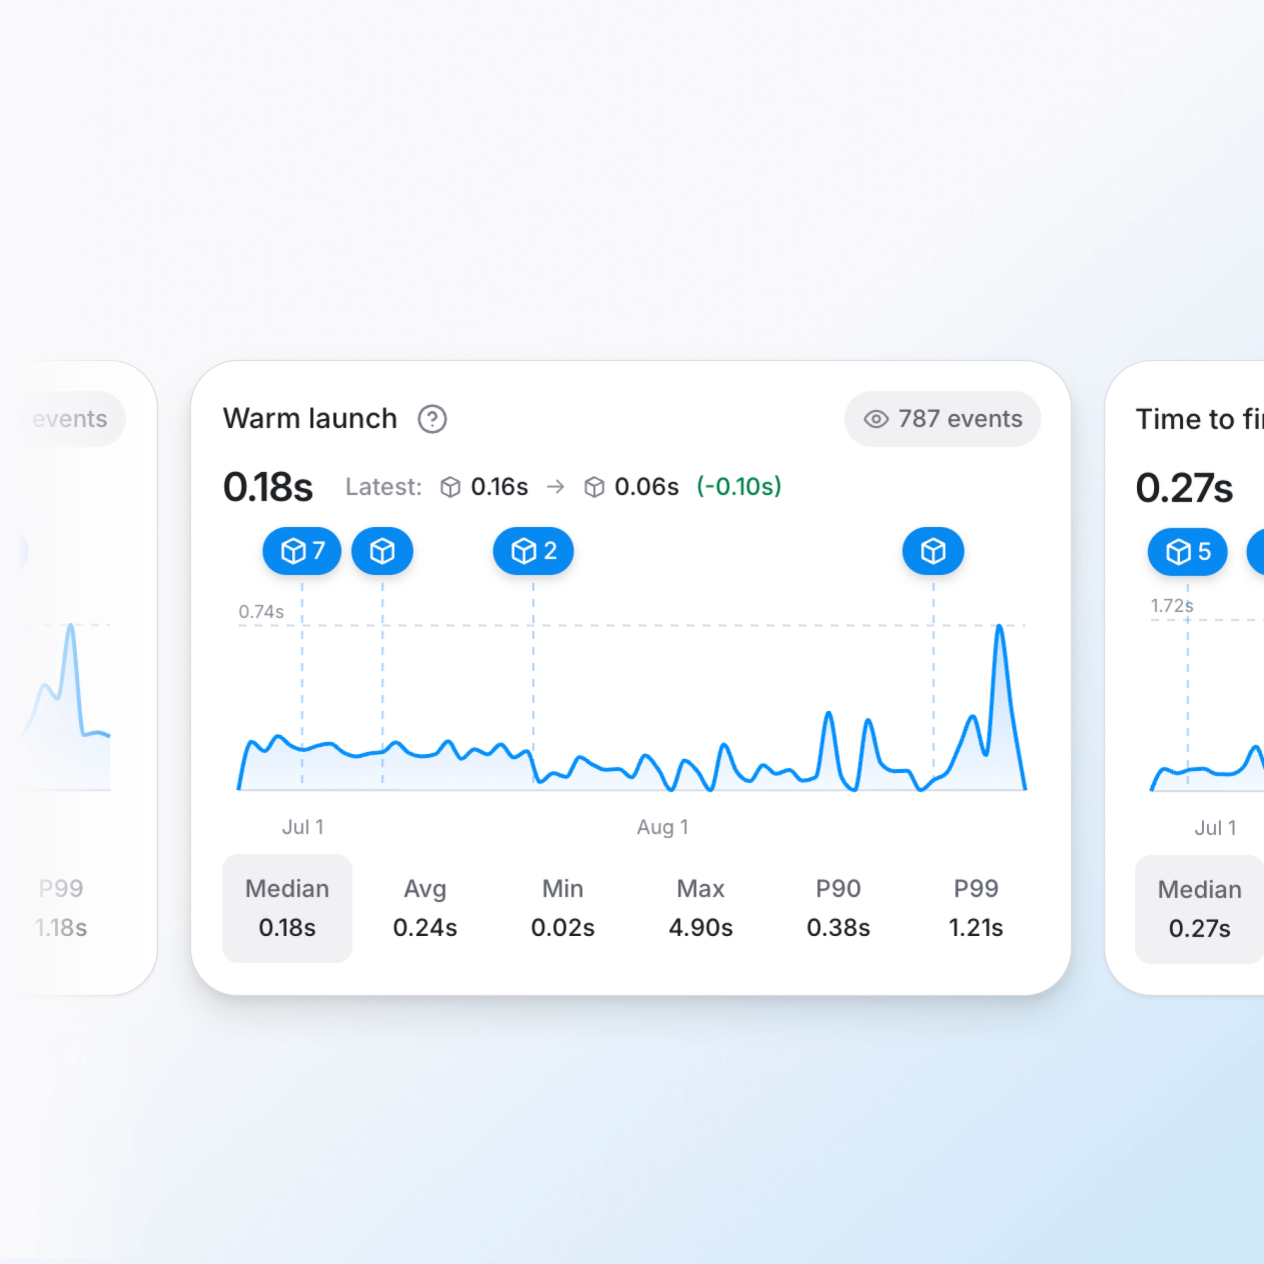
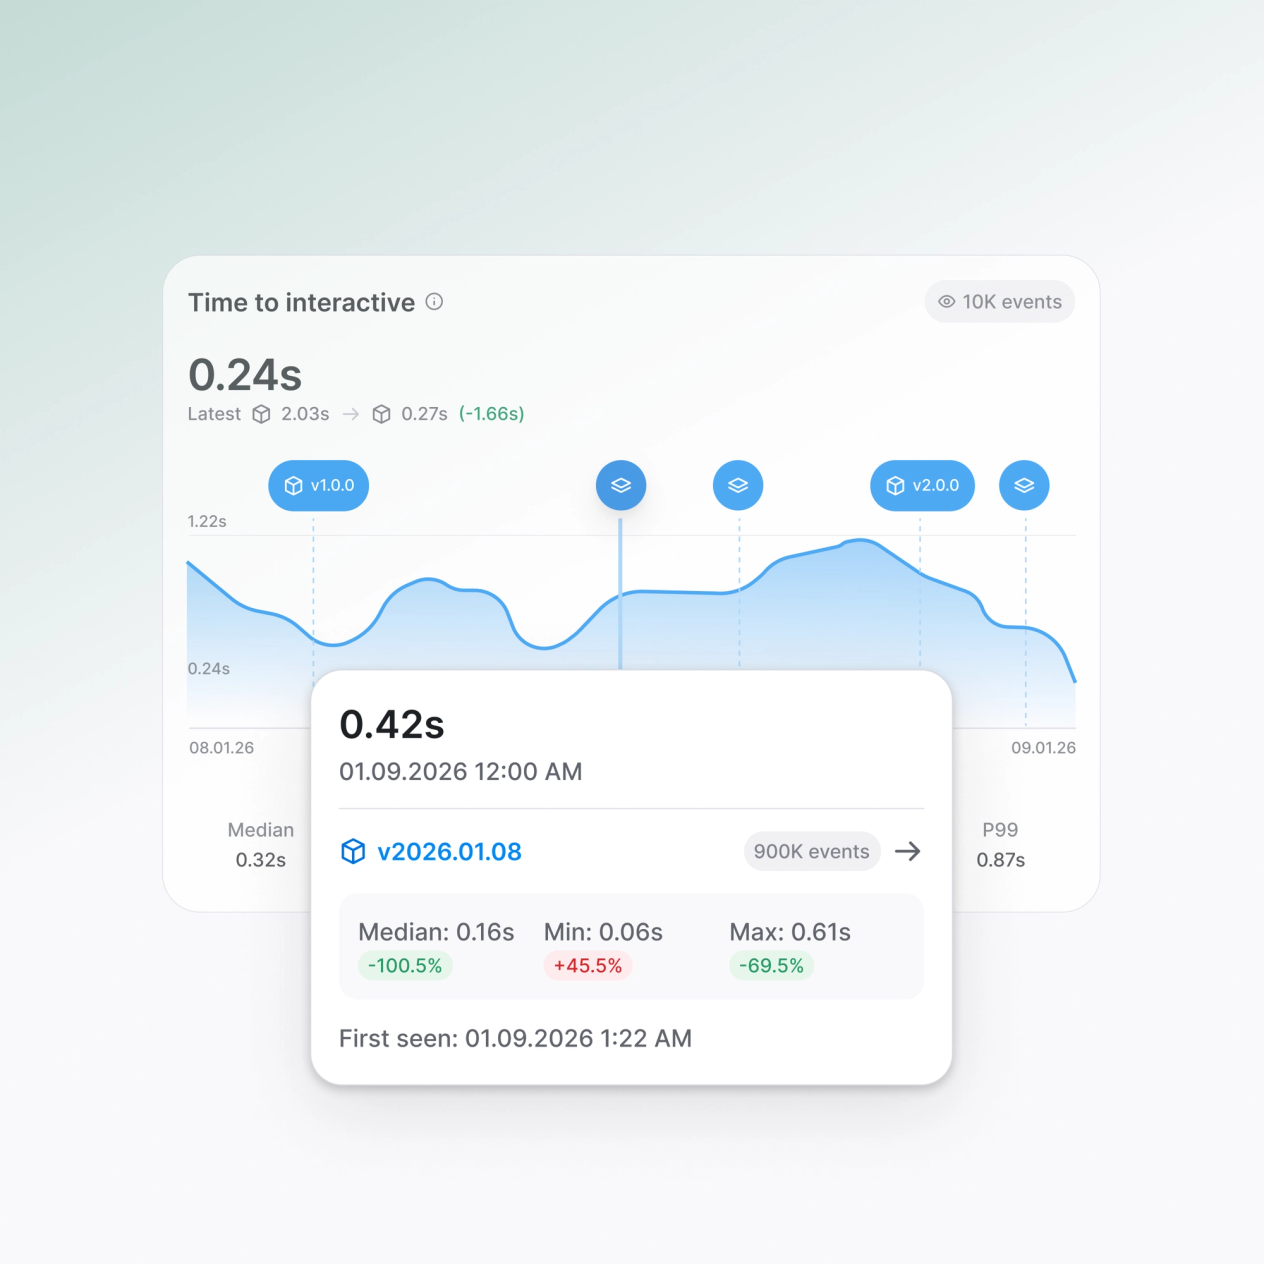
Every release appears as a marker on the timeline. Hover for the delta, or click to see every event from that build or OTA update.
Handoff to AI
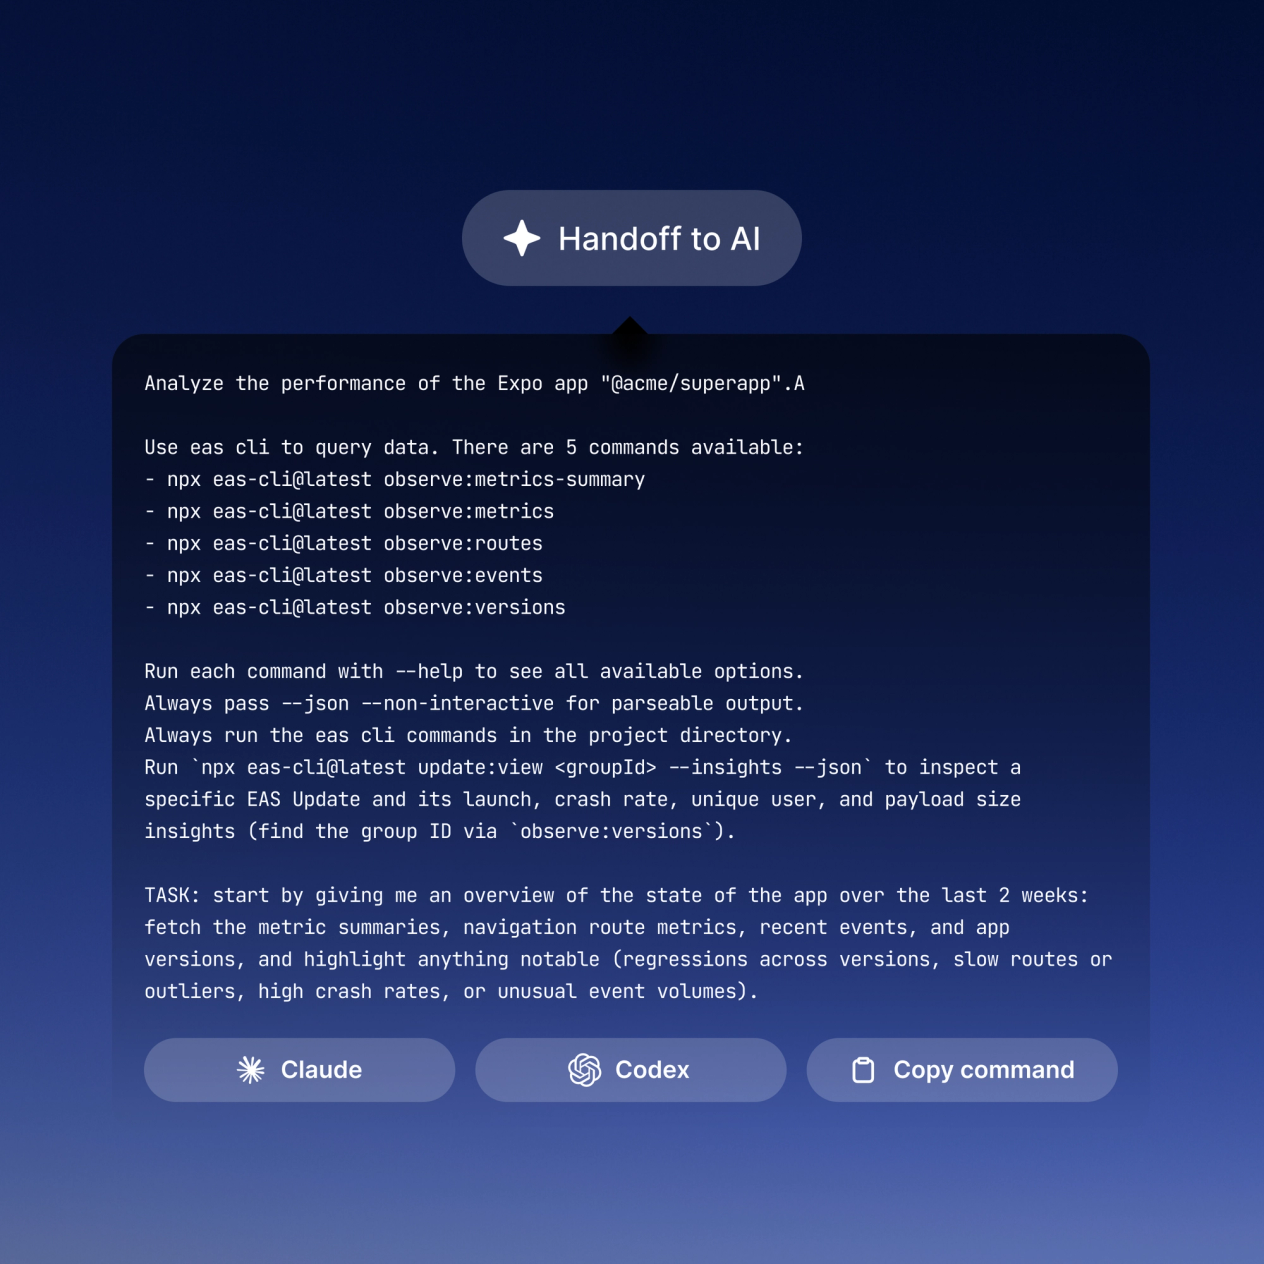
One tap in the dashboard, or pipe JSON from the CLI into Claude Code, Cursor, or any agent of your choice. Real answers from real sessions.
Optimize your app’s startup
Monitor five essential startup metrics across every session with full P50, P90, and P99 distributions. From native Cold and Warm launches to Bundle Load times, our platform tracks the journey from the first pixel rendered to full interactivity.
Visualize session timelines
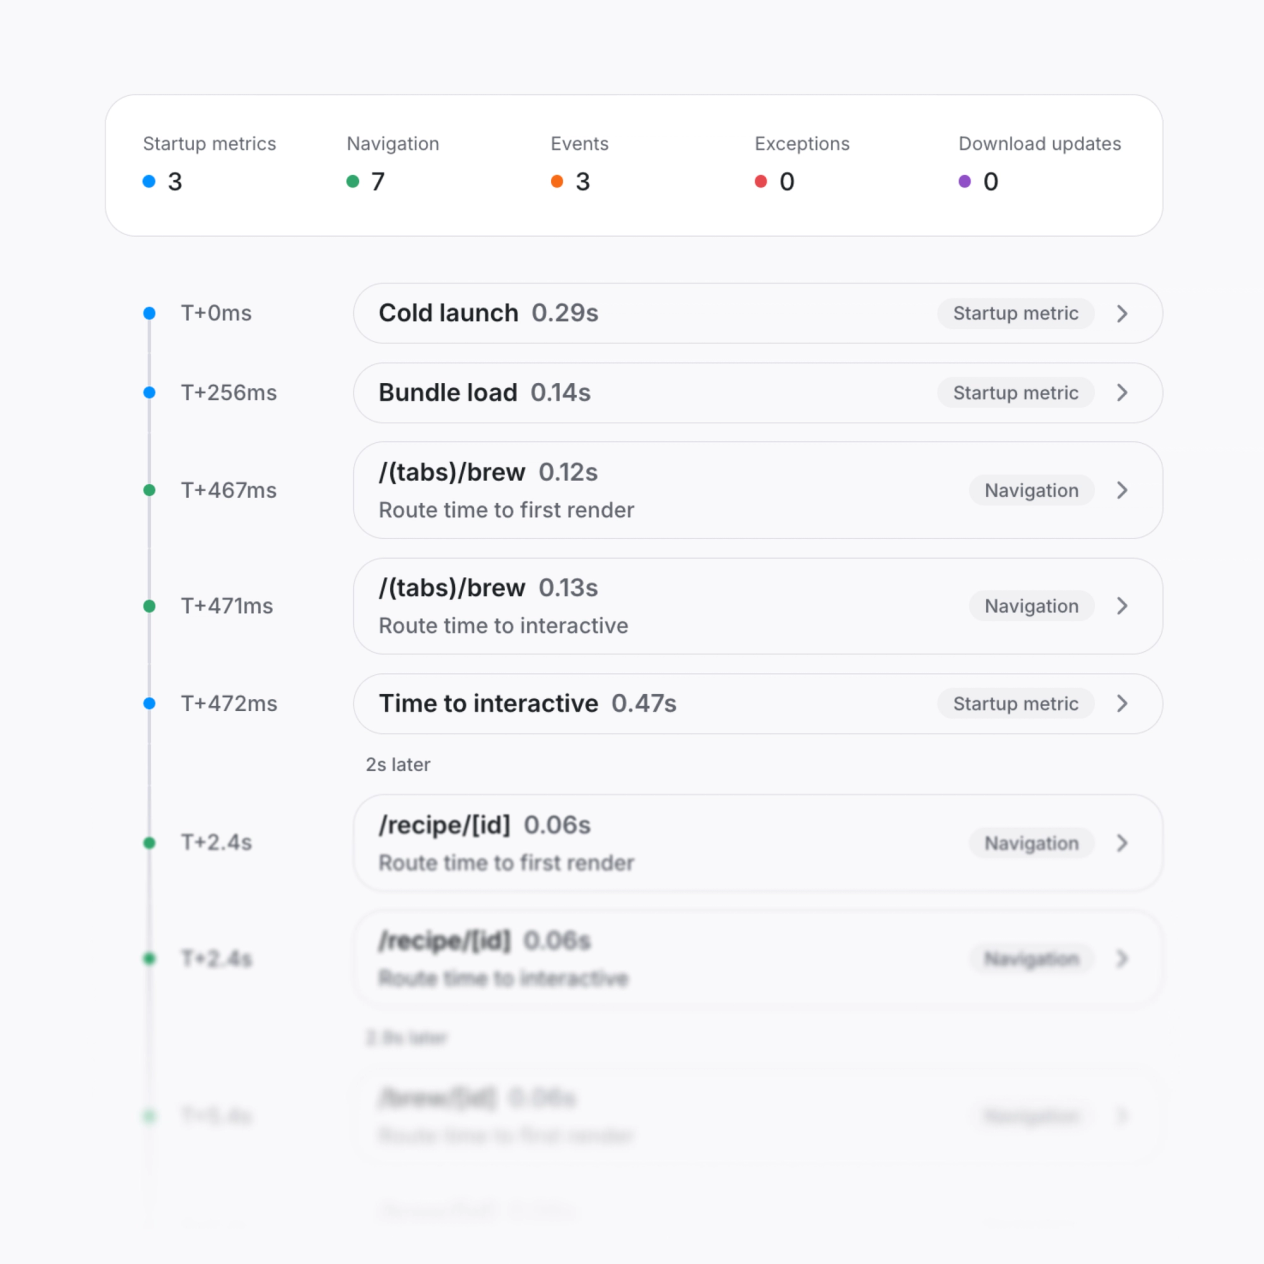
Log checkout, onboarding, or a failed sync with Observe.logEvent, then follow navigation, performance, and your own events through one session to see what happened before a user converted or dropped off.
Full error reporting
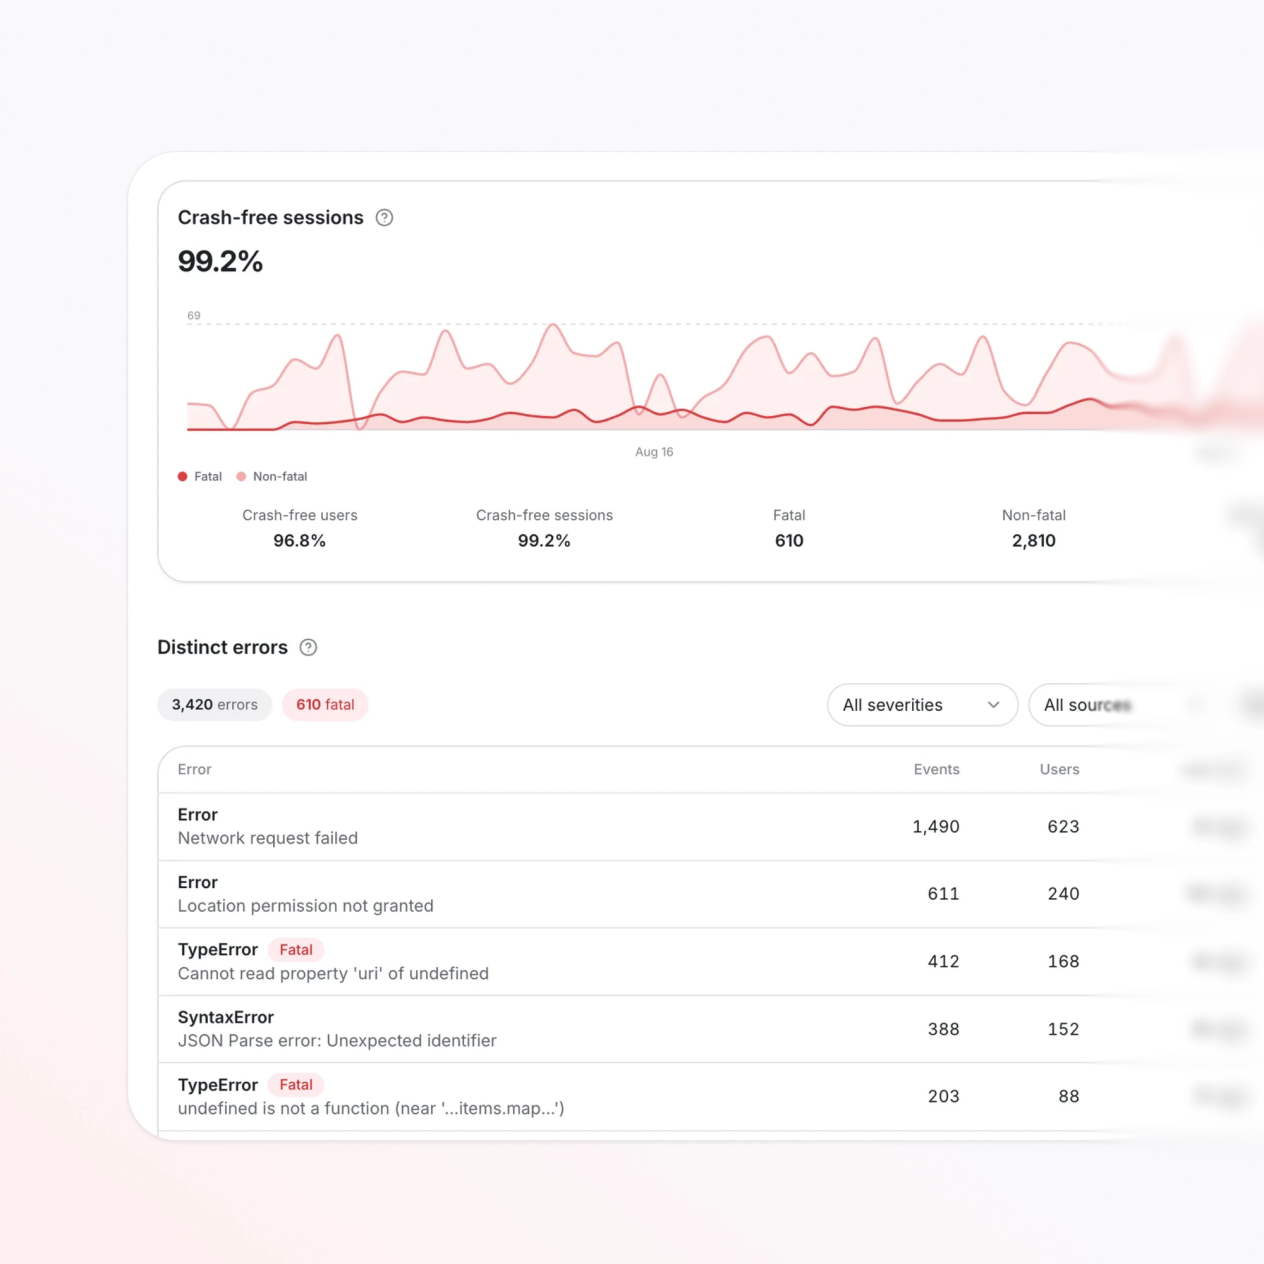
Crash-free sessions, errors grouped by cause, and a stack trace naming your file and line, so you know whether the fix ships as an update or needs a new build.
Your agent gets the full context.
Observe previews the prompt before it copies, so you see exactly what your agent receives: the metric, the affected sessions, the build, and the regression delta. No copy-pasting numbers from a dashboard. No explaining the situation from scratch.
Know what every release did.
Every build and OTA update lands as a marker on the performance timeline. Hover for the delta. Click to see every session from that version. The EAS Update tab shows download and apply time alongside performance metrics, so a slow update rollout never looks like a slow app. Catch a bad release before your users report it.
See which screen is slowing things down.
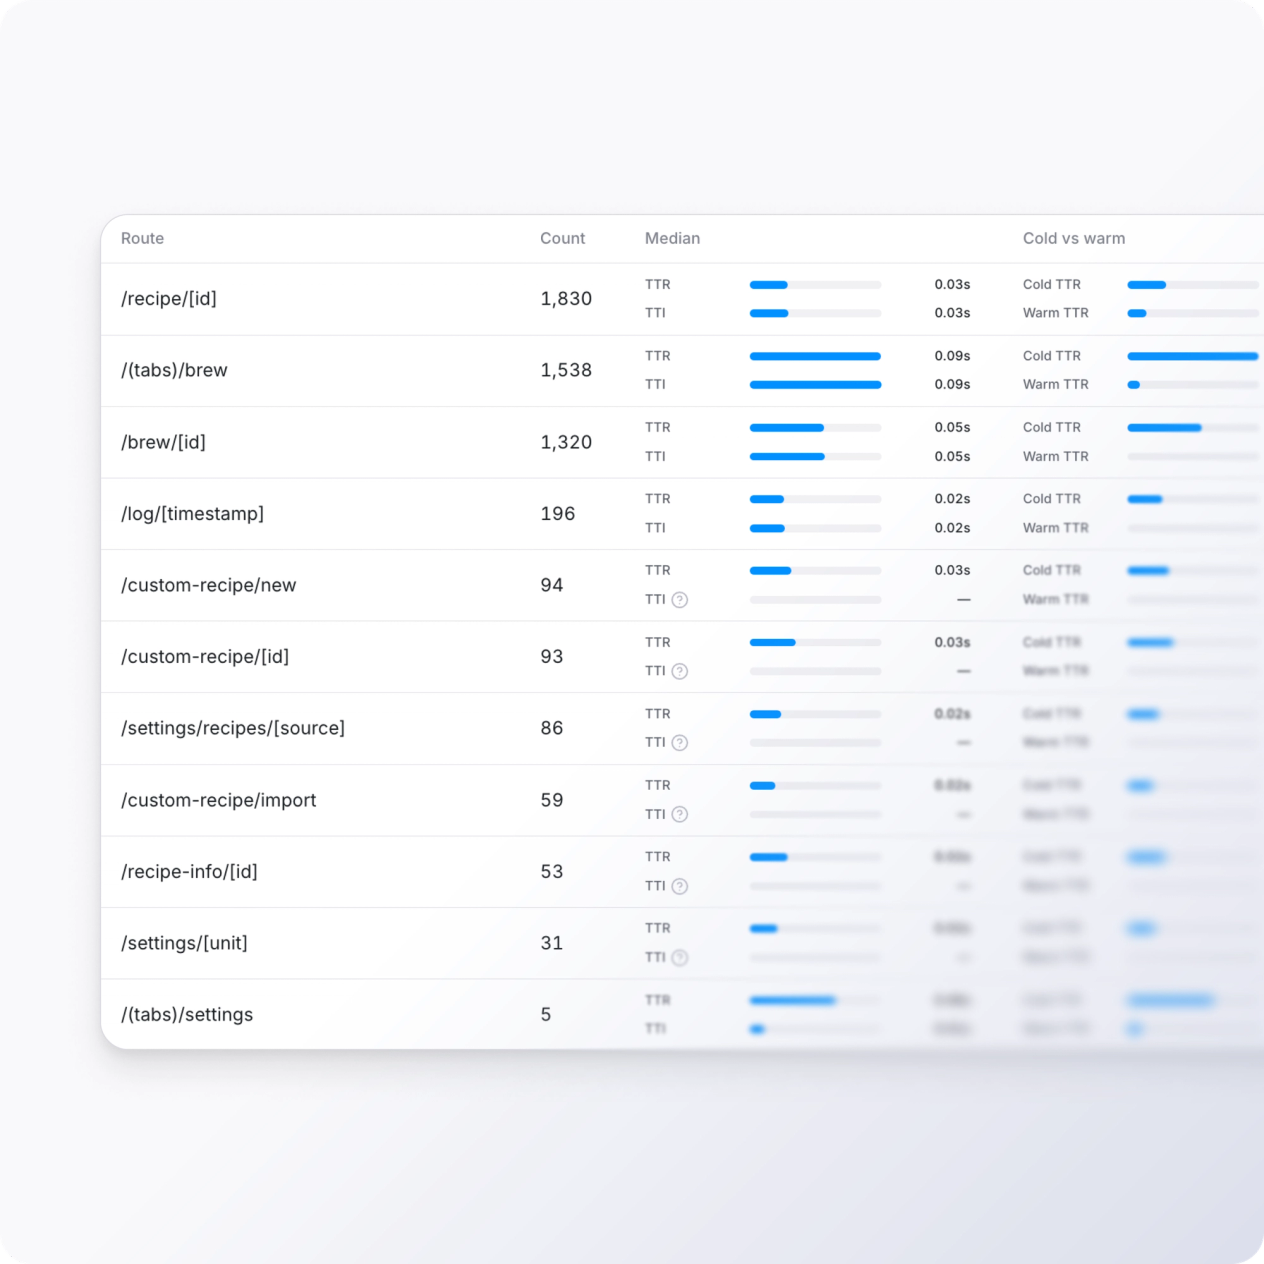
Most performance tools give you one number for the whole app. With Expo Router Integration, the Navigation tab breaks time to interactive down by route, so you find the slow screen instead of guessing. Multi-select routes to compare them directly across builds and updates.
The full picture
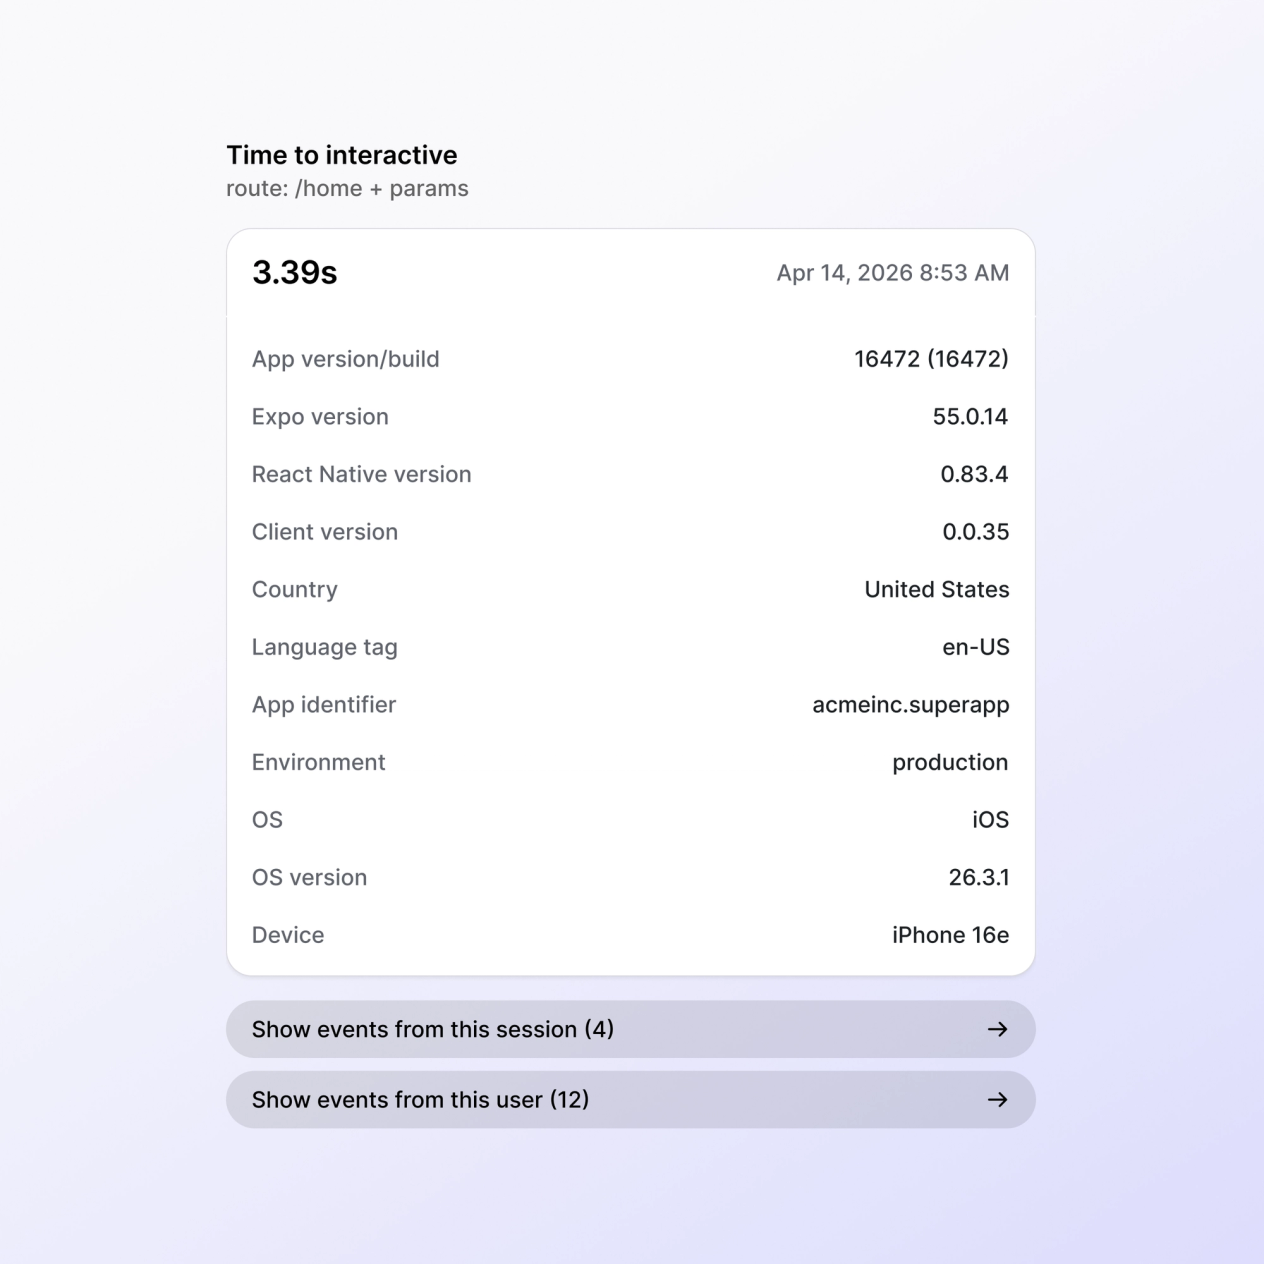
P50, P90, and P99 show you the full range: from your fastest flagship session to your slowest budget device. Sort slowest-first to focus where performance matters most. Drill into any session to see device, OS, update channel, and every event in the timeline.
Observe: Ship faster apps
Observe is a new service we released to track performance metrics in your mobile apps. You'll get metrics like time to interactive (TTI), time to render (TTR), cold launch, warm launch, and bundle load times. You can also see performance for every screen in your app, to see where your users are waiting the most.
Frequently Asked Questions
Have more questions or need human support?
Talk to the team with our contact page or socials.
Measure how it feels
One command. Real metrics in minutes. Built into every build you ship.