React Native startup metrics explained
What launch time, bundle load time, time to first render and time to interactive measure in a React Native app, where each one starts and ends, and how the same metrics are named across Sentry, Firebase, Datadog and Android vitals.

Launch time
Native startup time before your JavaScript can influence anything.
Bundle load
Load + evaluate JS bytecode / bundle. Good to evaluate bundle size, top-level JS work.
Time to render (TTR)
First React UI appears. Tells about render path, initial component tree.
Time to interactive (TTI)
The screen actually works. Tells about data fetching, hydration, “feels slow”.
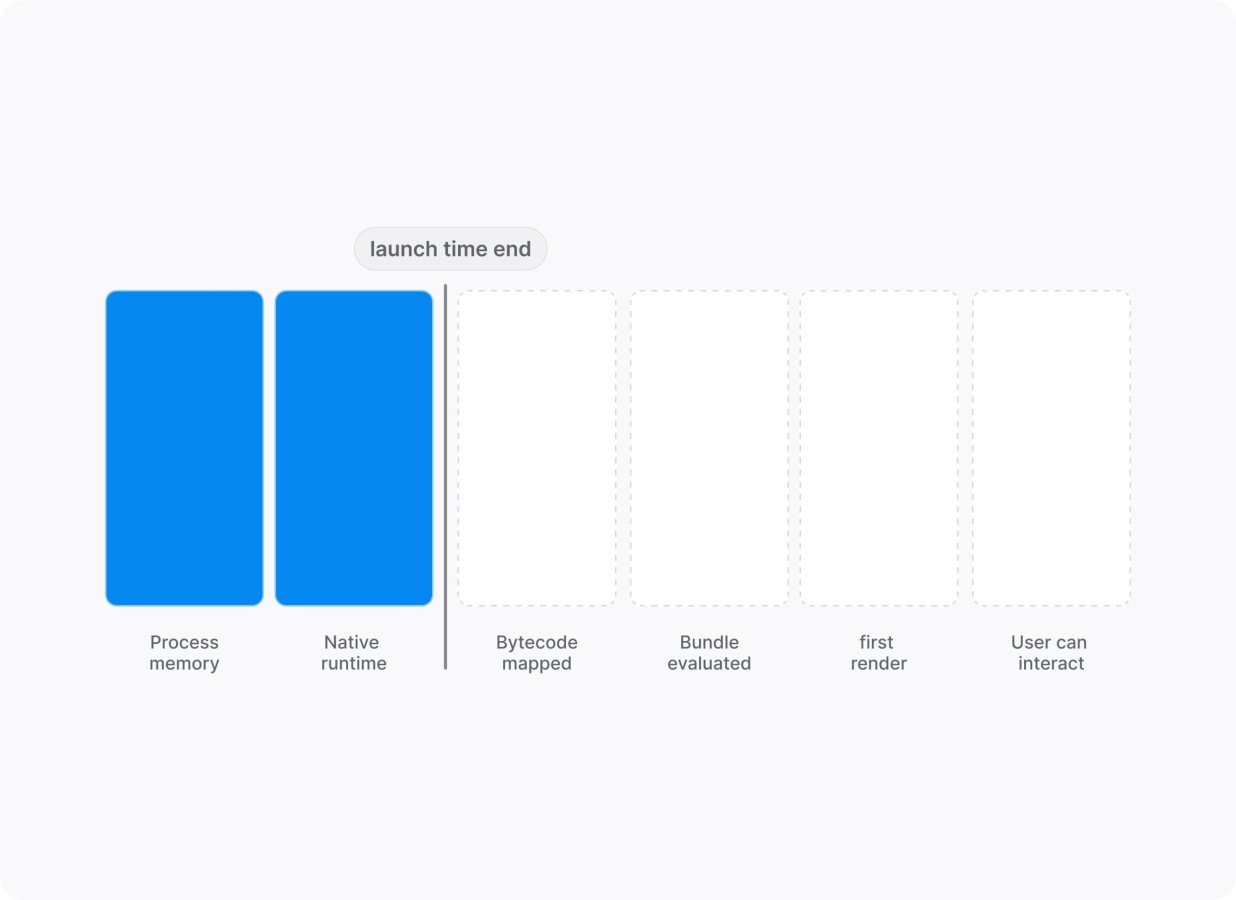
Launch Time
Time from process creation to when the system has finished allocating memory and initializing the runtime enough to begin UI rendering.
How it’s measured
Platform-native instrumentation (Android launch states; iOS MetricKit launch histograms). Vendor SDKs typically report separate cold/warm buckets (definitions vary by platform and vendor).
What usually makes it worse
Unused native modules / frameworks increasing work at process start. Static initializers that run before the app has control (Objective‑C +load, C++ static constructors). Config plugins pulling in native dependencies unintentionally.
What to optimize first
Remove unused native modules and avoid work in static initializers. Verify you’re not comparing “cold” across platforms or vendors unless the start/end events truly match.
Bundle load
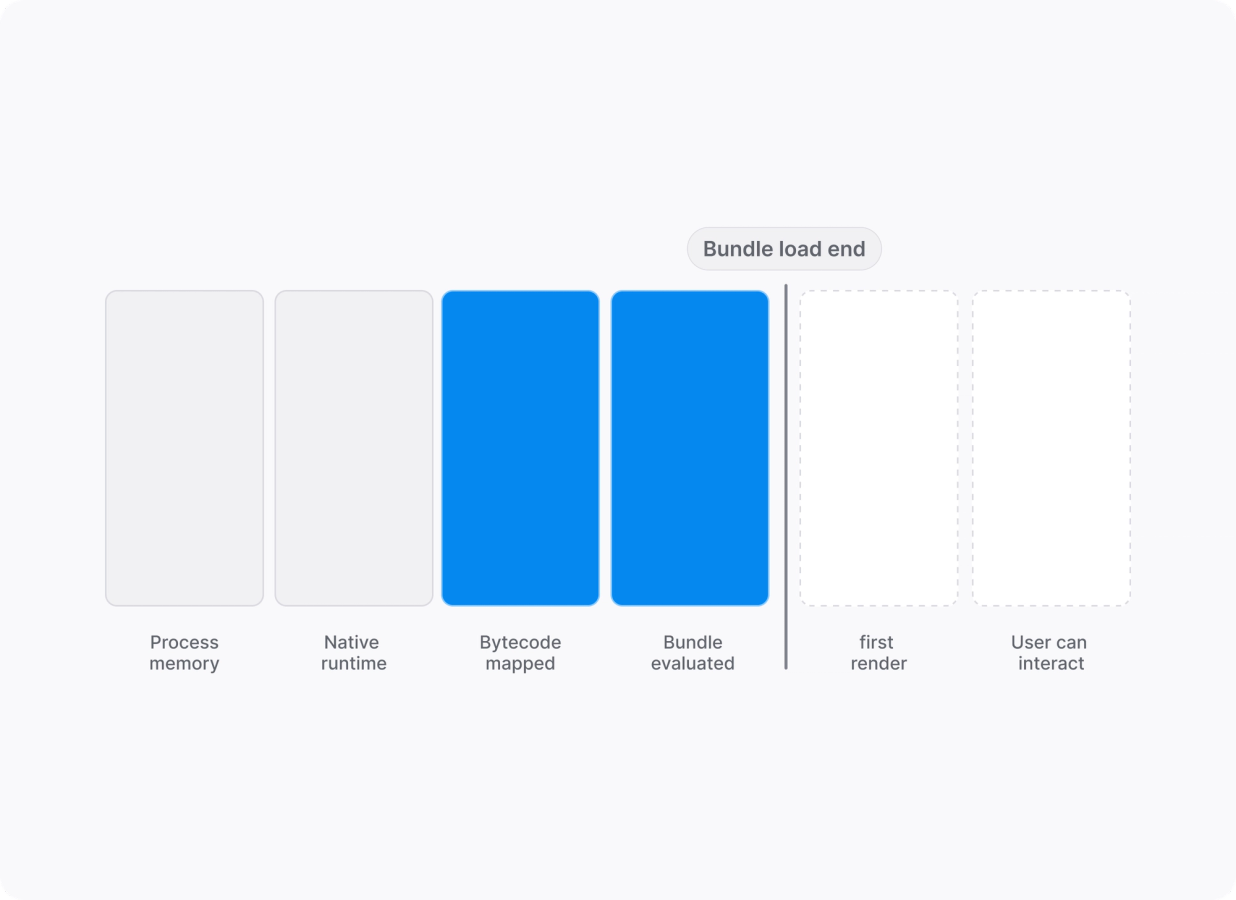
Duration of loading the JS bytecode/bundle and evaluating it. In React Native, bundle evaluation is what executes registerComponent; runApplication happens after evaluation.
How it’s measured
Often not reported by native-focused tools (it gets folded into “app start”). When it is reported, it typically comes from JS-engine or RN-specific marks (or a specialized library).
What usually makes it worse
Large bundles (more bytecode to map/load and more top-level JS to execute). Heavy work at module scope (top-level statements, eager imports). Too much code on the critical path to first screen (e.g. importing large feature areas up front).
What to optimize first
Reduce JS shipped/executed at startup: code-splitting where possible, defer non-critical imports, remove expensive top-level work. Confirm Hermes is actually using the optimized bytecode path in your setup.
Time to render (TTR)
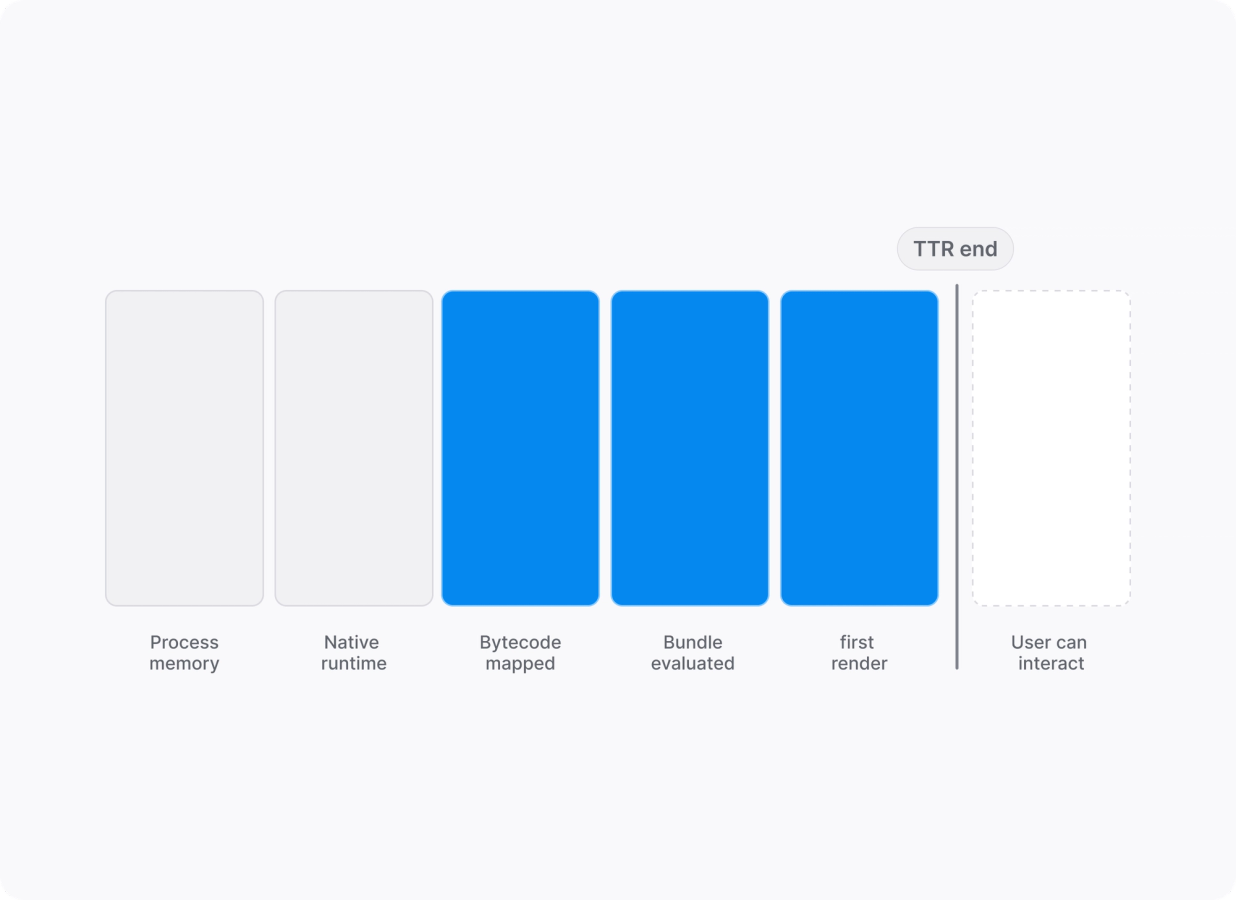
From when the app finishes native launching to when the root React component’s first render appears on screen.
How it’s measured
Can often be measured automatically (first frame / first render signals), though tools vary on what they treat as “initial display”. In practice, TTR is easy to over-credit: a splash, skeleton, or spinner can render quickly while the app is still unusable.
What usually makes it worse
Expensive initial React tree (layout, large lists, synchronous work in render). Heavy synchronous JS between “JS starts” and the first committed UI. Bundle load dominating the critical path (because evaluation must finish before render begins).
What to optimize first
Measure whether TTR is dominated by bundle load vs. render work. Simplify the first screen’s render path (ship less UI, defer non-critical components, avoid sync work before first paint).
Time to interactive (TTI)
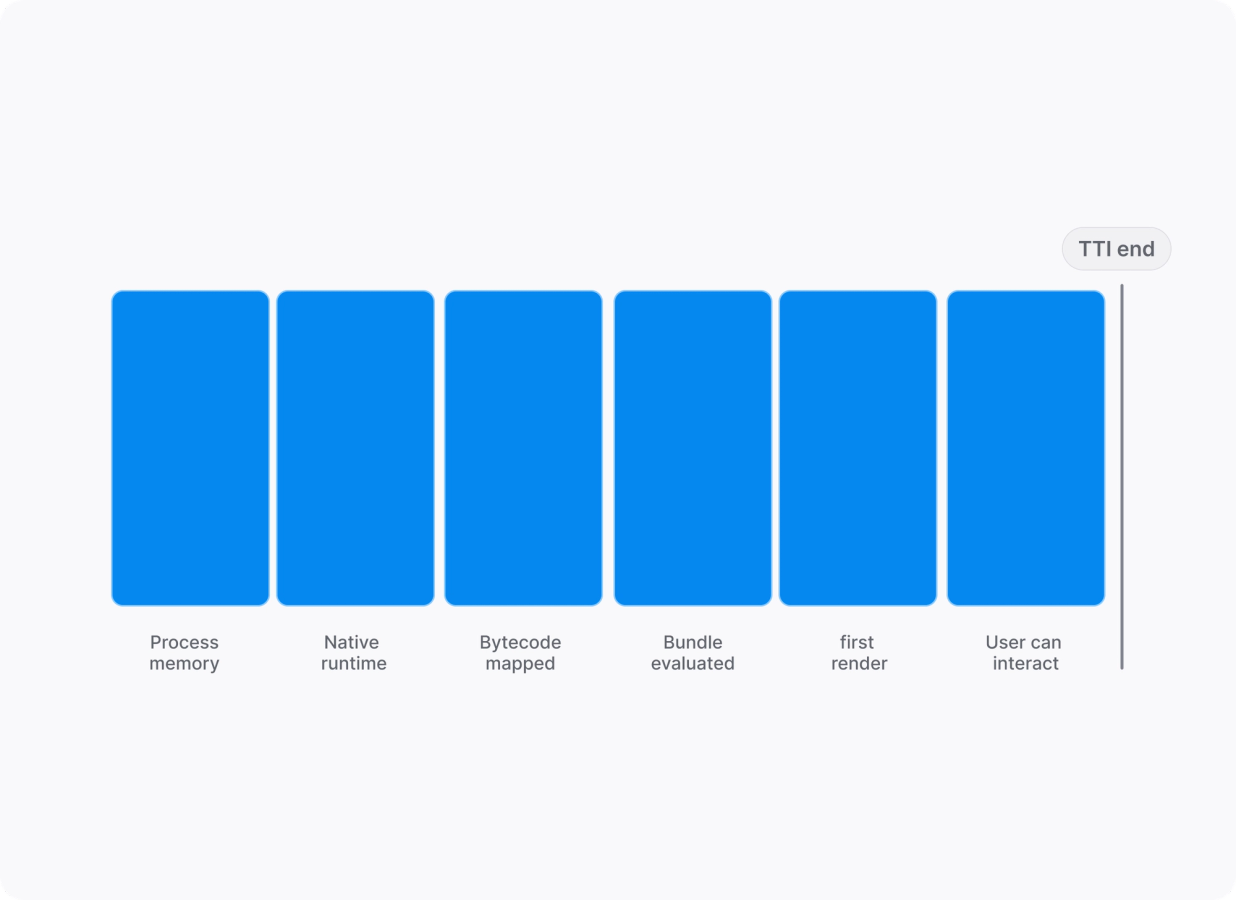
Time between the warm or cold launch and when the user can tap, scroll, and interact.
How it’s measured
Requires an app signal: no platform can infer “usable” from pixels. Android: reportFullyDrawn(); Sentry: reportFullyDisplayed(); Shopify: interactive: true; Expo: markInteractive().
What usually makes it worse
Post-render work: data fetching waterfalls, state hydration, expensive first navigation, large initial list work. Marking “interactive” too early (inflates performance on paper) or too late (makes regressions hard to interpret). Held splash screens that let “first frame” happen without true usability.
What to optimize first
Start here: it’s the only metric that matches user perception. Compare TTI vs TTR: big gap means the problem is after render (fetching/hydration/handlers); small gap means the problem is upstream (bundle load / native launch).