Workflows insights aggregates data from all of your workflow runs in the insights tab on the Expo dashboard. You can monitor key metrics like success rates, active runs, and failure counts, while observing trends over time to understand how your workflows are performing.
Understanding your workflows
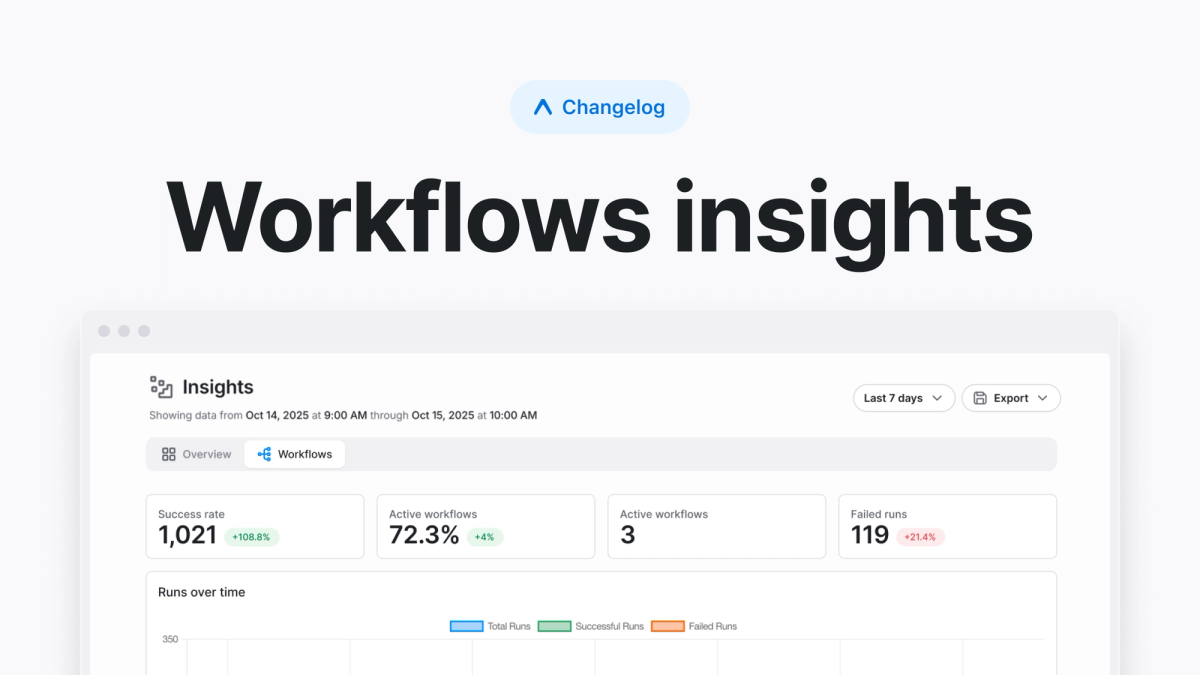
Workflows insights collects and visualizes data about how your workflows are performing. This includes:
- Success and failure rates of every workflow
- Number of active workflows
- Failed run counts
- Trends over time
The graphs on the dashboard show runs over time and their statuses. This view allows you to spot patterns over time, like if a change introduced a regression or a bug fix solved a job's error. Below the graph, there's a table, which you can filter and search. It shows data about specific workflows and their runs, so that you can zero-in on specific workflows.
When to use workflows insights
Workflows insights are valuable when you have a team all using shared CI/CD workflows to build, test, and release your app. For example, if you have end-to-end tests as a part of your release process, this dashboard can help you easily identify when a test job started erroring, which is a vital clue when debugging which change introduced an issue.
This dashboard is also helpful when you want to analyze CI/CD usage across your organization. You might spot that a vital workflow is taking longer than you'd like, which could lead to an effort to optimize that workflow to run faster. Workflows insights turns anecdotal data into quantitative data that helps you and your team make decisions.
Getting started
Workflows insights is available to organizations on the Production and Enterprise plans. You can access insights by going to your project's insights tab.
Once there, you can customize the timeframe from 1 hour to up to 30 days of history on the Production plan or up to 1 year of history on the Enterprise plan. You can also export your data directly if you'd like to find insights of your own.
Workflows insights makes it easier to maintain reliable workflows at scale, giving you the visibility you need to keep your CI/CD pipelines healthy.